
Posted in Safety Information on January 5, 2020
An Analysis of Pedestrian and Bicycle Crashes within one mile of the coast
A rising number of non-motorist collisions in cities along the Southern California coast inspired us to ask: how many accidents involving pedestrians and bicyclists have occurred in the beach communities of Orange and Los Angeles Counties? Where are non-motorists at the highest risk of being struck by a vehicle?
We turned to data visualization firm 1Point21 Interactive to help us find the answer. We analyzed seven years of data from the California Highway Patrol and mapped out all collisions involving a pedestrian or a bicyclist within one mile of the coast in Orange and LA Counties from 2010-2016.
Interactive Map of All Non Motorist Crashes
Drag and zoom in on this map to reveal detailed information. For visitors on mobile devices, rotate for best experience.
A full width version of this map is available here
Key Findings
- From 2010-2016, 3,993 total non-motorist accidents occurred within a mile of the beach. 1,635 involved a pedestrian, while 2,423 involved a cyclist.
- Santa Monica had the most bike accidents, while Long Beach had the most pedestrian collisions.
- 21.2 percent of all bicycle collisions occurred along Pacific Coast Highway.
- A disproportionately high amount of bike collisions occurred in in summer months, with the most occurring in July. Bike accidents in July alone accounted for nearly 14 percent of bike collisions on the beach.
- A higher percentage of non-motorist fatalities (34.6 percent) and severe injuries (58 percent) occur during daylight hours.
The Most Dangerous Zones for Non-Motorists in Coastal Orange and Los Angeles Counties
After mapping our coastal collision data, we grouped crashes into zones – clusters of incidents located within a specific radius of each other. These are the most dangerous zones in the area within one mile of the coast.
*This table is scrollable. Scroll to reveal more detailed information for each zone.
[wpdatatable id=4]
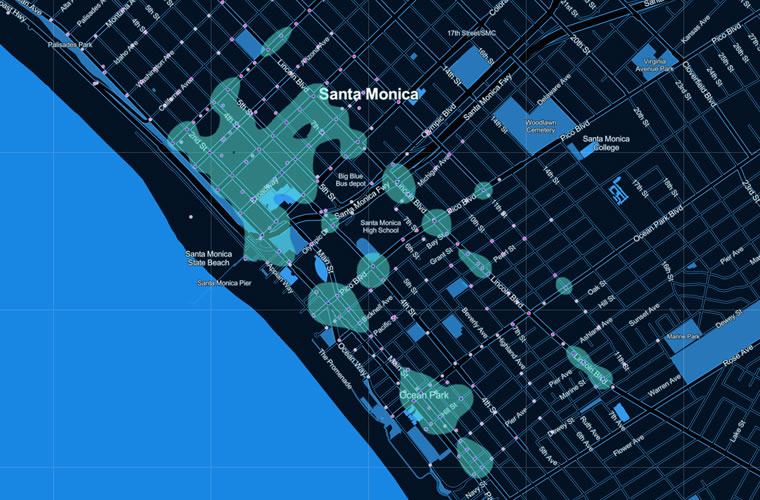
Santa Monica
Santa Monica had 571 bike collisions and 383 pedestrian accidents – the most bike incidents among all listed beach cities. It is notable also for having the largest zone, a wide swath on 2nd Street and Broadway that contained 304 total non-motorist collisions.
Long Beach
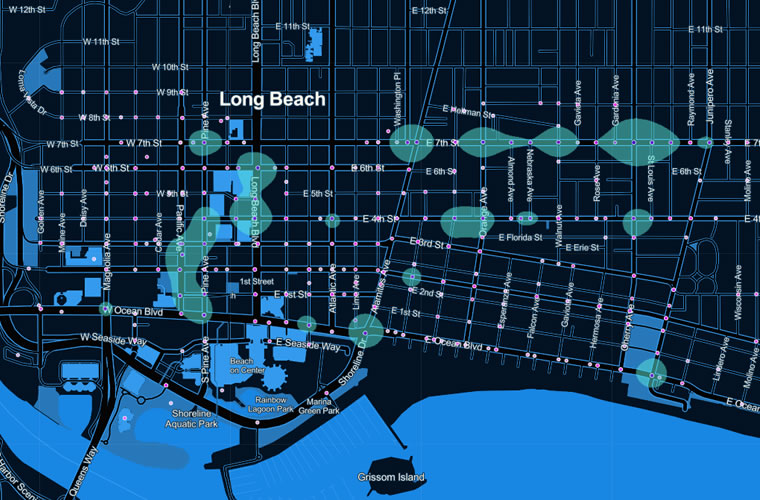
Long Beach contained 539 bike accidents and 417 pedestrian collisions – the most pedestrian collisions among our list of beach cities. According to our data, there seem to be large clusters of non-motorist collision activity along 4th Street and Long Beach Boulevard. It is also important to note that the intersection at Ocean Boulevard and Shoreline Drive is singularly responsible for 15 total crashes – 12 of them bike-related.
Huntington Beach
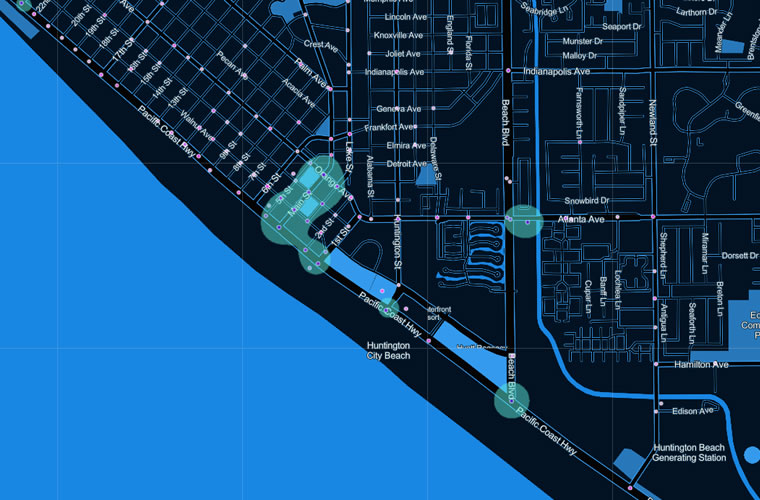
Huntington Beach recorded 332 bike accidents and 144 pedestrian collisions. Pacific Coast Highway seems to bear the brunt of non-motorist collisions, with the largest zone (at 80 total crashes) on PCH and Main Street. Additionally, single intersection clusters along the highway have large numbers of crashes, most notably the intersection at Beach Boulevard, which accounted for 20 total crashes.
Newport Beach
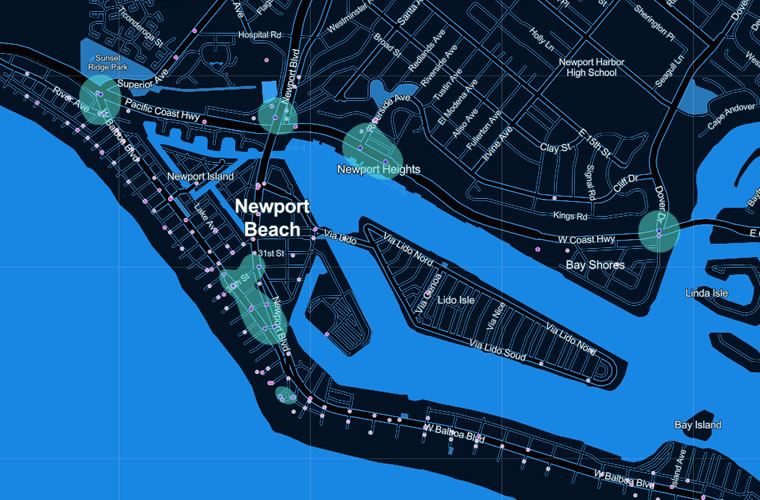
Newport Reach had 402 bike collisions and 116 pedestrian accidents, primarily located on Coast Highway and Newport Boulevard. Notable zones include a large cluster on Balboa and Newport that accounted for 41 total crashes, and a zone on Coast Highway and Riverside Avenue that recorded 39 total crashes – 38 involving a bicycle.
Pedestrian Accidents vs Bike Accidents at the Beach
According to our data, non-motorist accidents along the Orange County and LA County coasts seemed to more commonly involve cyclists rather than pedestrians. The number of cyclists involved was nearly 50 percent higher than the number of pedestrians in non-motorist collisions.
It is important to note that totaling pedestrian and bike accidents gives a number considerably higher than the 3,993 total non-motorist accidents recorded. We suspect this may be due to incidents in which both pedestrians and bicyclists were involved.
Non-Motorist Collisions by City
[wpdatachart id=3]
At 956 crashes, the city of Long Beach had the highest amount of total non-motorist collisions. Santa Monica ranked second with 953 crashes, and Newport Beach was a distant third with 518. Huntington Beach was fourth, with 476 total collisions.
Long Beach had the most pedestrian collisions, while Santa Monica tallied the most bike accidents. Interestingly, Long Beach and Santa Monica each tallied more bike collisions than Newport Beach’s total collisions combined.
Non-Motorist Accidents by Month
Pedestrian accidents remained fairly consistent month to month, but bicycle accidents experienced a spike in the summer months, from June to September. According to our analysis, this peaks in July with 332 collisions – 13.7 percent of all bike collisions along the coast.
Pacific Coast Highway – A Major Location for Bike Collisions
Pacific Coast Highway, known for heavy volumes of vehicle and bicycle traffic, displayed a large amount of bicycle accidents in our analysis. Of 2,423 bike accidents occurring within 1 mile of the beach, 516 of those were on PCH. That is 21.2 percent of all bike collisions along the beach in our analysis.
How Do These Findings Compare with Countywide Non-Motorist Collision Data?
By month, a higher percentage of non-motorist crashes occur in the summer months in the beach cities than in Orange and LA Counties combined. For example, beachside bike accidents in July accounted for nearly 14 percent of total beachside bike accidents, while the proportionate number for county wide accidents in July was nearly 5 percent lower.
Additionally, non-motorist collisions along the coast are less likely to be hit and runs than those in Orange and LA Counties overall.